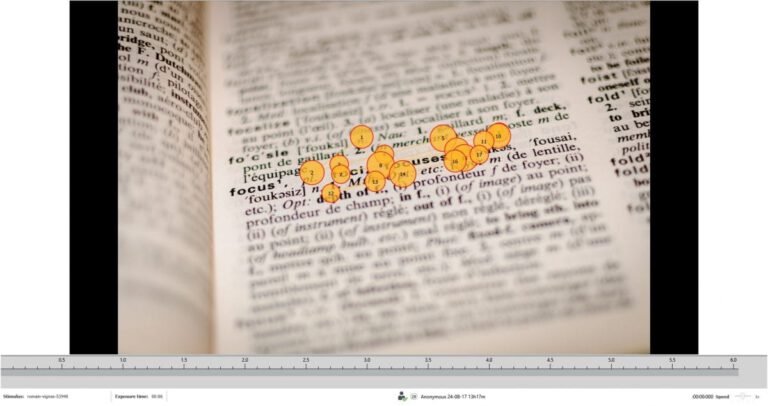
When a person reads, their eyes do not move continuously: they stop at specific points (fixations), jump from one to the next (saccades) and often go back over what has already been read (regressions). In dyslexic reading those patterns change measurably. That is why eye tracking lets us observe the how of reading, where speed or comprehension tests only show the how much.
Below we review five cross-cutting best practices and the five most effective study designs for investigating reading and dyslexia with eye tracking.
Five best practices for designing reading research
Before choosing a design, it is worth establishing five principles that underpin any serious reading research:
- Define the reading process up front. Reading spans visual encoding, word recognition, syntactic processing and discourse comprehension. You need to pin down which cognitive operation you are investigating.
- Control the stimulus variables. Change one variable at a time. Text properties — word length and frequency, syntax, typeface, line spacing, luminance, contrast — significantly influence reading behavior.
- Match the unit of analysis to the question. Word-level designs suit decoding studies; sentence-level designs suit syntax; paragraph-level designs suit comprehension strategies.
- Separate processing effort from outcome. Speed and accuracy reflect outcomes, not cognitive cost. Similar performance can hide substantial differences in effort or strategy.
- Establish normative baselines first. Every task should be validated on typical readers before being applied to clinical populations, so effects are not misattributed.
1. Controlled reading paradigms
Goal: to isolate specific sources of decoding and linguistic processing difficulty.
Methodology
- Participants read a carefully controlled text while their eye movements are recorded.
- Only one or two variables are manipulated (word frequency versus orthographic complexity, for instance).
- Sentences are matched for length, syntax and semantic predictability.
- Constant presentation, line by line or by paragraph (avoid scrolling unless it is essential).
- You define AOIs (areas of interest) at word or region level and separate first pass from rereading.
- Mean fixation duration per word
- First-pass time
- Revisits
- Regression probability
Why it works for dyslexia: it cleanly separates decoding difficulty from higher-level comprehension demands.
2. Group comparison studies (readers with and without dyslexia)
Goal: to identify differences in reading strategy, not just in speed or accuracy.
Methodology
- Two or more groups perform identical reading tasks under identical conditions.
- Participants matched for age, education and language proficiency.
- Standardized reading scores are collected for use as covariates.
- Mixed-effects models to account for individual variability.
- Fixation duration variability
- Saccade amplitude distribution
- Scanpath entropy or stability
Why it works for dyslexia: differences usually show up in variability and strategy, not just in the average. Group comparison reveals processing patterns that mean metrics can hide.
3. Typography and layout evaluation
Goal: to measure how design decisions influence reading effort.
Methodology
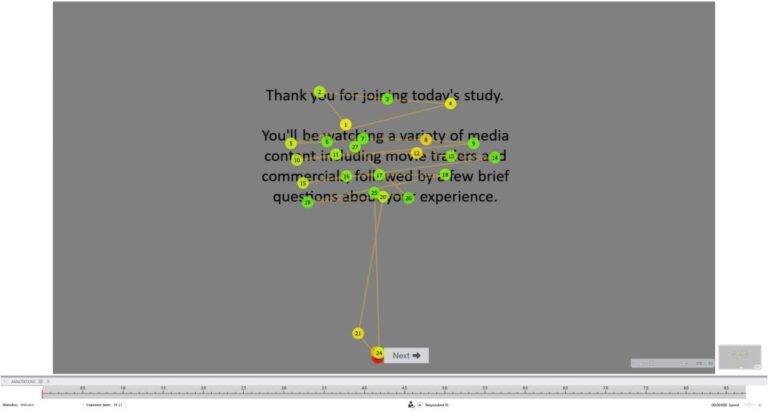
- Participants read the same text in different visual formats (typeface, line spacing, line length).
- Within-subject design: it reduces variability but risks learning effects; presentation order must be counterbalanced.
- Between-subjects design: it avoids carryover but requires larger samples.
- Keep luminance and contrast constant; avoid decorative typefaces unless they are the object of study.
- Use line- or paragraph-level AOIs (more stable than word-level ones in layout studies).
- Fixation density per line
- Regression density
- Pupil dilation relative to baseline
Why it works for dyslexia: it captures effort differences even when comprehension scores do not change, revealing cognitive load differences invisible to traditional measures.
4. Task demand manipulation
Goal: to separate decoding effort from the cognitive load imposed by the instruction.
Methodology
- The text stays constant; what changes is the task (reading for comprehension versus reading to spot errors, for instance).
- Unambiguous instructions, with prior practice.
- The eye tracking recording is synchronized with the task phases or stimuli.
- Include a low-load baseline task as a reference.
- Temporal irregularity of fixations
- Task-evoked pupil dilation
- Changes in the timing of regressions (rather than in their frequency)
Why it works for dyslexia: it determines whether the increase in load comes from decoding, from the instruction, or from both, distinguishing different sources of reading difficulty.
5. Longitudinal and intervention studies
Goal: to track how cognitive load evolves over time.
Methodology
- Eye tracking is recorded across several sessions (before and after interventions such as reading training or assistive technology).
- Identical hardware, calibration and lighting across all sessions.
- Use parallel versions of the text rather than repeating the same passage (this avoids practice effects).
- Analyze trends within each participant, not just group averages.
- Reduction in fixation duration over time
- Decrease in regression frequency
- Stabilization of the pupil response
Why it works for dyslexia: it captures improvements in effort even when reading speed changes slowly, revealing an intervention’s benefits at the processing level before they show up as speed.
Glossary of key metrics
- Fixation
- The time the eye remains steady on a word or region.
- First-pass time
- The duration of the initial reading of a region, before any regression.
- Regression
- A backward eye movement over text already read.
- Saccade
- A rapid eye movement between two fixations.
- AOI (area of interest)
- A predefined region of the stimulus on which fine-grained analysis is performed.
- Pupil dilation
- Variation in pupil size, an indicator of cognitive load.
- Scanpath
- The complete pattern of the gaze journey across the text.
What this means for applied research in Latin America
These five designs are complementary: they run from decoding a single word to the effectiveness of a real-world intervention. Together they demonstrate a principle that runs through all of neuromarketing and experience research: measuring processing effort, not just the outcome, reveals mechanisms that traditional assessments cannot see.
The same methodological rigor — stimulus control, participant matching, separating effort from performance — applies when studying how people read a package, an ad, a shelf or an interface. The difference between an anecdote and a solid business decision lies in the study design.
Let’s bring this precision to your next study
At the Databrain Lab we apply research-grade instrumentation and validated protocols to measure attention, effort and emotional response, in the lab and in the field.
Request a studyFrequently asked questions
Why is eye tracking used to study dyslexia?
Because it directly captures processing effort and reading fluency — not just the reading outcome. It measures in milliseconds where, how long and how the gaze settles, revealing decoding difficulties that traditional speed or comprehension tests miss.
Which eye tracking metrics matter in reading?
The main ones are fixation duration, first-pass time, regressions (backward jumps in the text), saccade amplitude, scanpath and pupil dilation as an index of cognitive load.
Can dyslexia be detected with eye tracking?
Eye tracking provides objective indicators of reading effort that complement professional assessment. It does not replace a clinical diagnosis, but it reveals processing patterns — greater variability, more regressions, longer fixations — characteristic of dyslexic reading.
Adapted and translated into English, with a Latin American focus, from the article “Top 5 Dyslexia Research Study Designs With Eye-Tracking” by Morten Pedersen (reviewed by Dr. Divya Seernani), published by iMotions.
